import pandas as pd
import datetime as dt
import numpy as np

import plotly.express as px
url = 'https://raw.githubusercontent.com/neylsoncrepalde/projeto_eda_covid/master/covid_19_data.csv'
#transform date comlumns to datetime format together with the dataframe creation...
df = pd.read_csv(url, parse_dates = ['ObservationDate', 'Last Update'])
df.dtypes
SNo                         int64
ObservationDate    datetime64[ns]
Province/State             object
Country/Region             object
Last Update        datetime64[ns]
Confirmed                 float64
Deaths                    float64
Recovered                 float64
dtype: object
df.head()
| SNo | ObservationDate | Province/State | Country/Region | Last Update | Confirmed | Deaths | Recovered | |
|---|---|---|---|---|---|---|---|---|
| 0 | 1 | 2020-01-22 | Anhui | Mainland China | 2020-01-22 17:00:00 | 1.0 | 0.0 | 0.0 |
| 1 | 2 | 2020-01-22 | Beijing | Mainland China | 2020-01-22 17:00:00 | 14.0 | 0.0 | 0.0 |
| 2 | 3 | 2020-01-22 | Chongqing | Mainland China | 2020-01-22 17:00:00 | 6.0 | 0.0 | 0.0 |
| 3 | 4 | 2020-01-22 | Fujian | Mainland China | 2020-01-22 17:00:00 | 1.0 | 0.0 | 0.0 |
| 4 | 5 | 2020-01-22 | Gansu | Mainland China | 2020-01-22 17:00:00 | 0.0 | 0.0 | 0.0 |
Refining Columns
df.columns
Index(['SNo', 'ObservationDate', 'Province/State', 'Country/Region',
       'Last Update', 'Confirmed', 'Deaths', 'Recovered'],
      dtype='object')
import re

#re.sub(r'[/| ]', '') - will remove special characters(/ or empty spaces in this case).
def refine_cols(col_name):
    return re.sub(r'[/| ]', '', col_name).lower()
#changing column names to make thing easier.
df.columns = [refine_cols(i) for i in df.columns]
df.head()
| sno | observationdate | provincestate | countryregion | lastupdate | confirmed | deaths | recovered | |
|---|---|---|---|---|---|---|---|---|
| 0 | 1 | 2020-01-22 | Anhui | Mainland China | 2020-01-22 17:00:00 | 1.0 | 0.0 | 0.0 |
| 1 | 2 | 2020-01-22 | Beijing | Mainland China | 2020-01-22 17:00:00 | 14.0 | 0.0 | 0.0 |
| 2 | 3 | 2020-01-22 | Chongqing | Mainland China | 2020-01-22 17:00:00 | 6.0 | 0.0 | 0.0 |
| 3 | 4 | 2020-01-22 | Fujian | Mainland China | 2020-01-22 17:00:00 | 1.0 | 0.0 | 0.0 |
| 4 | 5 | 2020-01-22 | Gansu | Mainland China | 2020-01-22 17:00:00 | 0.0 | 0.0 | 0.0 |
Method 2: Using pandas apply function
df.countryregion.unique()
array(['Mainland China', 'Hong Kong', 'Macau', 'Taiwan', 'US', 'Japan',
       'Thailand', 'South Korea', 'Singapore', 'Philippines', 'Malaysia',
       'Vietnam', 'Australia', 'Mexico', 'Brazil', 'Colombia', 'France',
       'Nepal', 'Canada', 'Cambodia', 'Sri Lanka', 'Ivory Coast',
       'Germany', 'Finland', 'United Arab Emirates', 'India', 'Italy',
       'UK', 'Russia', 'Sweden', 'Spain', 'Belgium', 'Others', 'Egypt',
       'Iran', 'Israel', 'Lebanon', 'Iraq', 'Oman', 'Afghanistan',
       'Bahrain', 'Kuwait', 'Austria', 'Algeria', 'Croatia',
       'Switzerland', 'Pakistan', 'Georgia', 'Greece', 'North Macedonia',
       'Norway', 'Romania', 'Denmark', 'Estonia', 'Netherlands',
       'San Marino', ' Azerbaijan', 'Belarus', 'Iceland', 'Lithuania',
       'New Zealand', 'Nigeria', 'North Ireland', 'Ireland', 'Luxembourg',
       'Monaco', 'Qatar', 'Ecuador', 'Azerbaijan', 'Czech Republic',
       'Armenia', 'Dominican Republic', 'Indonesia', 'Portugal',
       'Andorra', 'Latvia', 'Morocco', 'Saudi Arabia', 'Senegal',
       'Argentina', 'Chile', 'Jordan', 'Ukraine', 'Saint Barthelemy',
       'Hungary', 'Faroe Islands', 'Gibraltar', 'Liechtenstein', 'Poland',
       'Tunisia', 'Palestine', 'Bosnia and Herzegovina', 'Slovenia',
       'South Africa', 'Bhutan', 'Cameroon', 'Costa Rica', 'Peru',
       'Serbia', 'Slovakia', 'Togo', 'Vatican City', 'French Guiana',
       'Malta', 'Martinique', 'Republic of Ireland', 'Bulgaria',
       'Maldives', 'Bangladesh', 'Moldova', 'Paraguay', 'Albania',
       'Cyprus', 'St. Martin', 'Brunei', 'occupied Palestinian territory',
       "('St. Martin',)", 'Burkina Faso', 'Channel Islands', 'Holy See',
       'Mongolia', 'Panama', 'Bolivia', 'Honduras', 'Congo (Kinshasa)',
       'Jamaica', 'Reunion', 'Turkey', 'Cuba', 'Guyana', 'Kazakhstan',
       'Cayman Islands', 'Guadeloupe', 'Ethiopia', 'Sudan', 'Guinea',
       'Antigua and Barbuda', 'Aruba', 'Kenya', 'Uruguay', 'Ghana',
       'Jersey', 'Namibia', 'Seychelles', 'Trinidad and Tobago',
       'Venezuela', 'Curacao', 'Eswatini', 'Gabon', 'Guatemala',
       'Guernsey', 'Mauritania', 'Rwanda', 'Saint Lucia',
       'Saint Vincent and the Grenadines', 'Suriname', 'Kosovo',
       'Central African Republic', 'Congo (Brazzaville)',
       'Equatorial Guinea', 'Uzbekistan', 'Guam', 'Puerto Rico', 'Benin',
       'Greenland', 'Liberia', 'Mayotte', 'Republic of the Congo',
       'Somalia', 'Tanzania', 'The Bahamas', 'Barbados', 'Montenegro',
       'The Gambia', 'Kyrgyzstan', 'Mauritius', 'Zambia', 'Djibouti',
       'Gambia, The', 'Bahamas, The', 'Chad', 'El Salvador', 'Fiji',
       'Nicaragua', 'Madagascar', 'Haiti', 'Angola', 'Cabo Verde',
       'Niger', 'Papua New Guinea', 'Zimbabwe', 'Cape Verde',
       'East Timor', 'Eritrea', 'Uganda', 'Bahamas', 'Dominica', 'Gambia',
       'Grenada', 'Mozambique', 'Syria', 'Timor-Leste', 'Belize', 'Laos',
       'Libya', 'Diamond Princess', 'Guinea-Bissau', 'Mali',
       'Saint Kitts and Nevis', 'West Bank and Gaza', 'Burma',
       'MS Zaandam', 'Botswana', 'Burundi', 'Sierra Leone', 'Malawi',
       'South Sudan', 'Western Sahara', 'Sao Tome and Principe', 'Yemen',
       'Comoros', 'Tajikistan', 'Lesotho'], dtype=object)
Confirmed Cases in Brazil
brasil = df.loc[(df.countryregion =='Brazil') & (df.confirmed > 0)]
px.line(brasil, 'observationdate', 'confirmed', title = 'Confirmed Cases in Brazil')

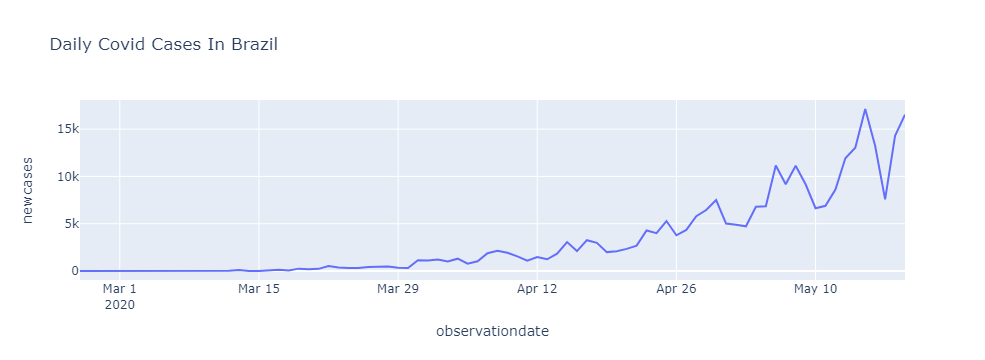
New Cases Per Day
# Returns the daily covid cases
brasil['newcases'] = list(map(
    lambda row: 0 if (row==0) else brasil['confirmed'].iloc[row] - brasil['confirmed'].iloc[row - 1], np.arange(brasil.shape[0])
))
px.line(brasil, x = 'observationdate', y = 'newcases', title = 'Daily Covid Cases In Brazil')

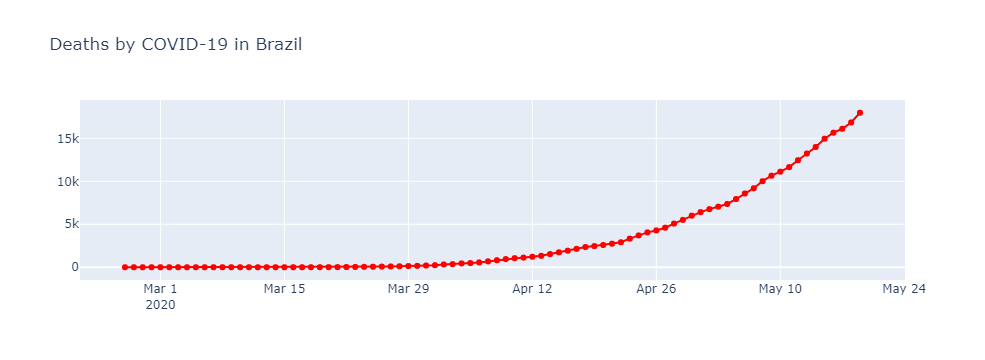
Deaths
import plotly.graph_objects as go
fig = go.Figure()

fig.add_trace(
    go.Scatter(x = brasil.observationdate, y= brasil.deaths, name = 'Mortes',
              mode = 'lines+markers', line = {'color': 'red'})
)

#layout
fig.update_layout(title = 'Deaths by COVID-19 in Brazil')

fig.show()

Growth Rate
- growth_rate = (present/past)**(1/n) - 1
def growth_rate(data, var, start = None, end = None):

    #if start date is None set the first date avaible
    if start == None:
        start = data.observationdate.loc[data[var] > 0].min()
    else:
        start = pd.to_datetime(start)

    if end == None:
        end = data.observationdate.iloc[-1]
    else:
        end = pd.to_datetime(end)

    #past and present dates values
    past = data.loc[data.observationdate == start, var].values[0]
    present = data.loc[data.observationdate == end, var].values[0]

    #number of time periods we'll be analyzing
    n = (end - start).days

    #calculate rate
    rate = (present/past)**(1/n) - 1

    return rate*100
growth_rate(brasil, 'confirmed')
16.27183353112116
def daily_growth_rate(data, var, start=None):
    #if start date is None set the first date avaible
    if start == None:
        start = data.observationdate.loc[data[var] > 0].min()
    else:
        start = pd.to_datetime(start)

    end = data.observationdate.max()

    n = (end - start).days

    rates = list(map(
        lambda x: (data[var].iloc[x] - data[var].iloc[x-1]) / data[var].iloc[x - 1],
        range(1, n + 1)
    ))

    return np.array(rates) * 100
daily_rates = daily_growth_rate(brasil, 'confirmed')
first_day = brasil.observationdate.loc[brasil.confirmed > 0].min()

px.line(x = pd.date_range(first_day, brasil.observationdate.max())[1:],
        y = daily_rates, title = 'Growth Rates of Confirmed Cases in Brazil'
       )

Making Predictions
from statsmodels.tsa.seasonal import seasonal_decompose
import matplotlib.pyplot as plt

confirmed_cases = brasil.confirmed
#setting observationdate as index
confirmed_cases.index = brasil.observationdate
confirmed_cases
observationdate
2020-02-26         1.0
2020-02-27         1.0
2020-02-28         1.0
2020-02-29         2.0
2020-03-01         2.0
                ...
2020-05-15    220291.0
2020-05-16    233511.0
2020-05-17    241080.0
2020-05-18    255368.0
2020-05-19    271885.0
Name: confirmed, Length: 84, dtype: float64
res = seasonal_decompose(confirmed_cases)
rows = 2
cols = 2
fig = plt.figure(figsize =(20,5))
fig.tight_layout(pad = 1.0)

#current series
ax = fig.add_subplot(2,2,1)
ax.plot(res.observed)

#trends
ax = fig.add_subplot(2,2,2)
ax.plot(res.trend)

#seasonality
ax = fig.add_subplot(2,2,3)
ax.plot(res.seasonal)

#residual
ax = fig.add_subplot(2,2,4)
ax.plot(confirmed_cases.index, res.resid)
ax.axhline(0, linestyle = '--', c = 'black')
plt.show()

ARIMA MODEL
- Auto Regressive Integrated Moving Average are used to predict future points.
- Used in charts that shows some trend. It won’t work well on stationary data.
from pmdarima.arima import auto_arima

model = auto_arima(confirmed_cases)
fig = go.Figure(go.Scatter(
                x = confirmed_cases.index, y = confirmed_cases, name = 'Observed'
               ))

fig.add_trace(go.Scatter(
    x = confirmed_cases.index, y=model.predict_in_sample(), name = 'Prediction'
))

fig.add_trace(go.Scatter(
    x = pd.date_range('2020-05-20', '2020-06-20'), y = model.predict(31), name = 'Forecast'
))

fig.update_layout(title= 'Confirmed cases forecast for the next 30 days in Brazil')
fig.show()

Growth Model
from prophet import Prophet
#preprocessing

#all data excluding the last 5 cases
train = confirmed_cases.reset_index()[:-5]


test = confirmed_cases.reset_index()[-5:]

#Renaming Columns
train.rename(columns = {'observationdate':'ds', 'confirmed' : 'y'}, inplace = True)
test.rename(columns = {'observationdate':'ds', 'confirmed': 'y'}, inplace = True)

#Defining Growth Model
prophet = Prophet(growth = 'logistic', changepoints = ['2020-03-21','2020-03-30','2020-04-25', '2020-05-03','2020-05-10'])


pop = 211463256
train['cap'] = pop

#training
prophet.fit(train)

#predictions
future_dates = prophet.make_future_dataframe(periods =200)
future_dates['cap']=pop
forecast = prophet.predict(future_dates)
fig = go.Figure()

fig.add_trace(go.Scatter(x=forecast.ds, y=forecast.yhat, name='Prediction'))
fig.add_trace(go.Scatter(x=train.ds, y=train.y, name='Observer - Train'))
fig.update_layout(title = 'Prediction on confirmed cases in Brazil')
fig.show()
